


You are likely familiar with the popular saying “the trend is your friend” already. If you believe the trend is your friend, then the Supertrend indicator can be your best friend. Forget about moving averages and trendlines. The super Trend indicator is arguably the most effective tool for market trend identification, and we will prove it.
Binary options trading is all about anticipating the direction of the next few candles. The Supertrend indicator will give you just that. In this article, we will explain what the Supertrend is and how it works. Then, we will introduce a Supertrend strategy for spectacular gains. And don’t worry, we will walk you through it step by step.
If you believe the trend is your friend, then the Supertrend indicator can be your best friend.
What Is the Supertrend Indicator?
First, let’s talk about what the Supertrend indicator is. The Supertrend is a technical analysis indicator developed by Olivier Seban. It identifies the market trend and informs you where to enter and exit trades. Of course, in binary options trading, we don’t care about the exit. However, having an optimal entry point will significantly improve your results.
With the Supertrend indicator, you will be able to determine the market trend instantly. It basically creates a mechanical approach to market trend identification. It means that the method is completely objective. So, you are safe from biased mistakes. With the right Supertrend indicator settings, the only thing you should do is hit the buy/sell button (or higher/lower when it comes to binary trading).
How Is the Supertrend Indicator Calculated?
Similar to any other technical indicator, there are math calculations behind the Supertrend. While most of you will be bored with this part, it might be beneficial to know how Supertrend is calculated. So, here is the Supertrend indicator formula:
Supertrend value = ( Max + Min ) / 2 + m ∗ ATR
Where:
- Max: The higher price of the asset during a specific time period.
- Min: The lowest price of the asset during the same time period.
- ATR: Average True Range, which is a measure of market volatility.
- m: The Multiplier, which is a constant value selected by the trader. It determines the sensitivity of the Super Trend indicator to volatility. The higher it is, the more sensitive the Supertrend gets.
Supertrend Strategy Pro Tip: Set the multiplier (m) in the Supertrend formula based on your risk parameters and trading style.
So, the Supertrend indicator formula consists of both the mean and a measure of standard deviation. If you’ve studied finance, you’ll know how essential these two parameters are for asset pricing predictions. The resulting value we get from the Supertrend formula is then plotted on the price chart as the Supertrend line.
How Does the Supertrend Indicator Work?
We will not bore you with theory anymore. Let’s explore how Supertrend works. The Supertrend indicator plots a line (a curve, to be specific) on the chart. Typically, when the trend is bearish, the Supertrend line will be displayed above the price. On the contrary, when the market is bullish, the Supertrend will be below the price. Red and green colors are also commonly used for each trend direction, respectively.
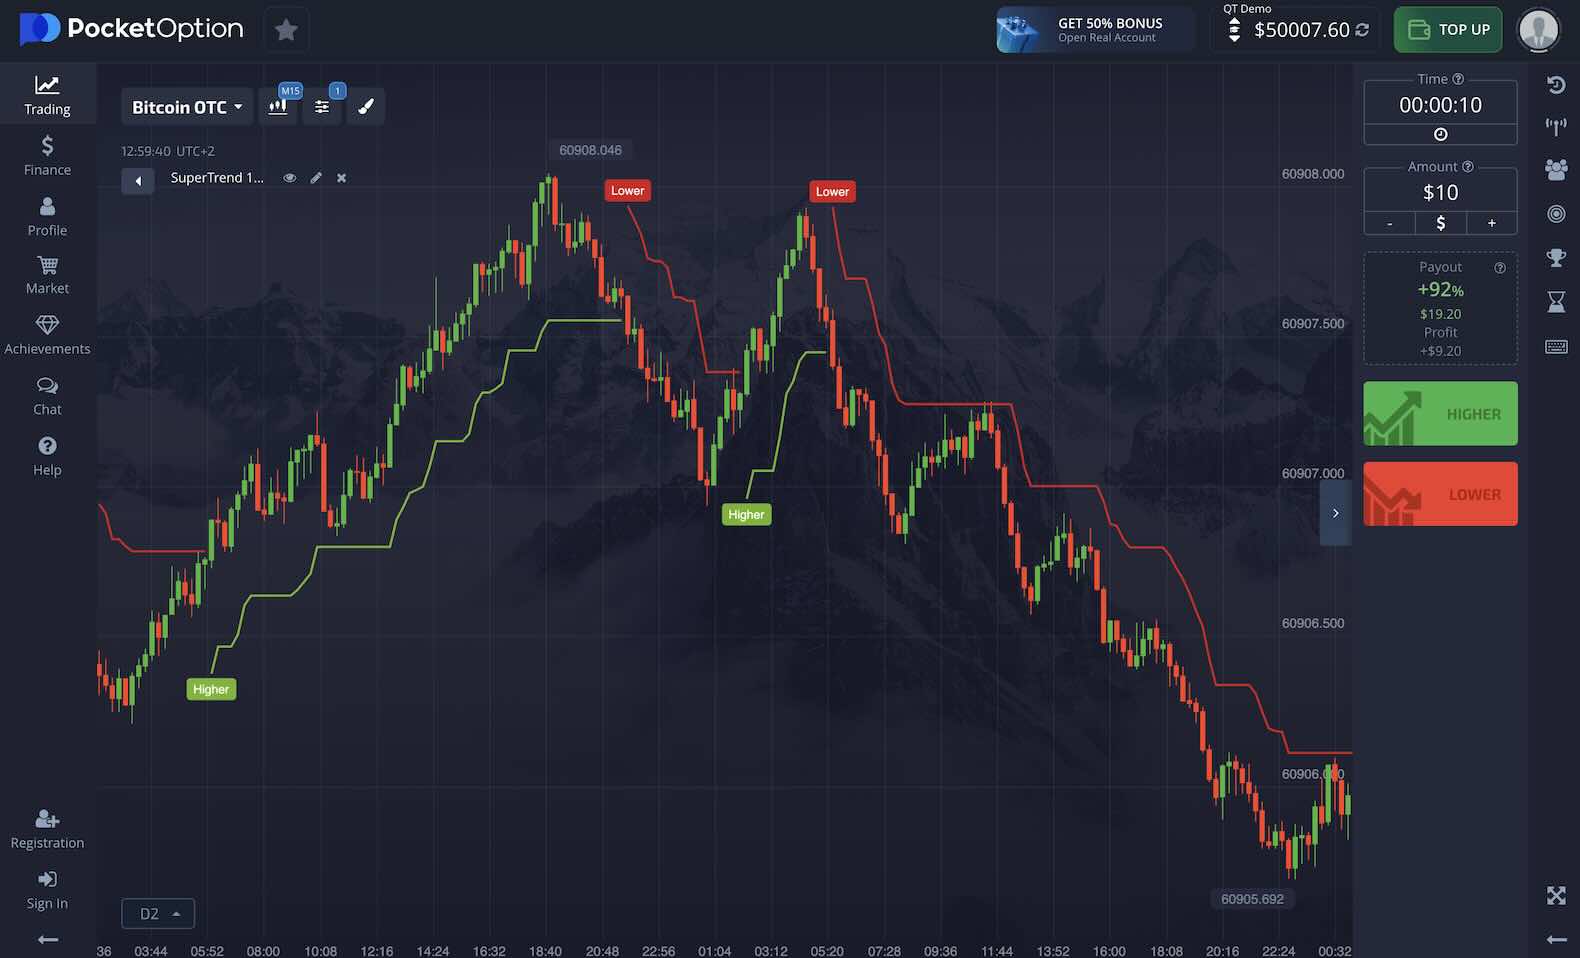
So, when the Supertrend shifts to green, it generates a buying signal. On the other hand, when it changes to red, it suggests selling. Moreover, as long as the Supertrend indicator is green (or below the price), the trend remains bullish and vice versa.
The Super Trend’s multiplier also allows you to modify its sensitivity. Meanwhile, the use of ATR in the Supertrend indicator formula already adjusts it for the volatility of the pair you will trade. So, the best Supertrend indicator settings mainly depend on your trading style. For instance, as a day trader, you should find the best Supertrend indicator settings for intraday trading.
The Benefits and Drawbacks of Using the Supertrend Indicator
Now that you know what the Supertrend indicator is and how it works, it’s time to know whether to use it or not. To help you decide, we present the most prominent advantages and disadvantages of using the Supertrend strategy:
Supertrend Indicator Pros
Here are the primary benefits of trading with the Super Trend indicator:
User-Friendliness
It’s very easy to understand how Supertrend works, even as a beginner. It has a straightforward visual presentation. So, you almost need no prior training to learn how to read Supertrend indicator signals. It displays a single line on the price chart and provides a clear buy or sell signal.
Trend Identification
The primary purpose of the Supertrend Indicator is to identify the market trend, and it does an exceptional job. The Supertrend clearly shows whether the market is bullish or bearish. The accuracy is also very high, as the Supertrend formula uses both the average price and the volatility of the asset. This makes it superior to tools like moving averages.
Volatility Adjustment
As mentioned already, the Supertrend accounts for volatility. The inclusion of the Average True Range (ATR) in the Supertrend indicator formula makes this possible. ATR measures the average market volatility. Therefore, for highly volatile markets, the Super Trend provides wider margins. This reduces the probability of generating false signals. Obviously, it does the opposite in less volatile markets and is more responsive to smaller price movements.
Clear Signals for Entry and Exit
The Supertrend clearly shows when to buy or sell an asset. Therefore, it practically tells you when to enter and exit positions. Of course, in binary options, you only care about entering the trade. When the Supertrend shifts from bullish to bearish (or vice versa), you can enter the binary option trade.
Supertrend Indicator Cons
As with any trading method, using the Supertrend strategy comes with its drawbacks and limitations. Here are some of the most important disadvantages you should be aware of:
Lagging Tool
Like almost all other technical analysis indicators, the Supertrend is a lagging tool. This means that there is a delay in its signals. The reason is that the Supertrend formula is based on historical price data. So, there is always a degree of uncertainty when it comes to predicting the future using the past.
Less Effective in Range-Bound Markets
In sideways or choppy markets, the price movements lack a clear direction. That is where the Supertrend indicator is likely to generate false signals. Considering that the financial markets are consolidating more than half of the time, this makes using the Supertrend strategy tricky. Rest easy, as we will provide some tips to tackle this problem. Yet, the risk will not go away totally.
Sensitivity Settings
The effectiveness of the indicator depends on the settings of the multiplier and the ATR period in the supertrend formula. On the one hand, a low multiplier makes the indicator very sensitive to price changes. This leads to generating many signals and can cause overtrading. On the other hand, a high multiplier reduces sensitivity, which might miss important signals. Finding the right balance requires experience, and this is the only area where using the Supertrend strategy can get challenging for beginners.
Might be Better with Other Tools
While the Supertrend Indicator provides valuable trend information, relying solely on it can be risky. It is because it does not account for all aspects of market conditions, like momentum or volume. Thus, using it with momentum oscillators like the RSI or CMO or volume indicators like VWAP can make it more accurate.
Supertrend Strategy Example: Can Supertrend Be the Best Indicator for Day Trading?
Now that we have clearly described what the Supertrend indicator is and how it works, it is time to provide some visual examples. In this section, we offer a real example from the TradingView charting platform.
Take a look at the 5-minute Ethereum chart below. It is evident that early in the day, the price broke above the supertrend dynamic line, and the supertrend indicators shifted to bullish. You could have entered write after the bullish shifting candle closed.
For the exit, you could have used the supertrend line as a dynamic stop loss level. That is, when the price has dropped below the line, and the Super Trend has shifted bearish, you could have closed the trade (after candle closure).
This example shows how the Supertrend might be one of the best indicators for day trading and, quite simply, the best trend indicator available for free. Moreover, if you want to backtest a trading strategy based on the Supertrend indicator, you can try one of the best Forex backtesting software tools in 2024.
Can You Use Supertrend as a Binary Options Trading Strategy?
As already pointed out, indicators like Supertrend are typically lagging. They are mostly late-to-call trend shifts. As a result, they offer opportunities with low reward/risk ratios but high win rates. Therefore, using Supertrend for binary options trading is not only possible, but it might also be the best indicator for option trading in trending markets. If you are interested in both day trading and binary options, read our article on how to become the best at day trading options.
Yet, make sure to backtest your Supertrend binary options strategy before applying it to live markets. The indicator might only work well on some instruments or timeframes. To do so, click on this link to create a free binary options demo account on Quotex.
What Is The Primary Limitation of the Supertrend Indicator?
The main downside of the SuperTrend indicator is its reliance on trending markets to perform optimally. The indicator works best when asset prices show sustained movements on either the upside or downside. However, in the absence of a well-defined trend, such as during volatile, choppy, or range-bound market conditions, the Supertrend becomes more prone to generating false buy or sell signals.
This presents a significant risk for traders who use the indicator during periods when the markets lack decisiveness. Following inaccurate signals during these non-trending conditions can lead to bad entries or exits. As such, while the Supertrend excels at identifying trends when they exist, its effectiveness is heavily dependent on the market’s trend.
As a result, you must exercise caution when relying solely on this indicator. You can even consider using it with other strategies to limit the risks associated with false signals.

Conclusion
The Supertrend indicator is a valuable technical analysis tool that shines in trending markets by providing clear buy and sell signals. The indicator leverages its ability to adapt to market volatility through the Average True Range. However, its reliance on sustained directional movements means it can generate false signals during non-trending, range-bound conditions.
To mitigate this limitation, traders should integrate the SuperTrend judiciously into a comprehensive trading approach involving other technical indicators, fundamental analysis, and robust risk management strategies. With prudent application within a well-rounded methodology, discipline, and continuous learning, the Supertrend indicator can be a powerful component of a trader’s arsenal for navigating dynamic financial markets.
If you are interested in more static trading systems, check out our guide on mastering the Fibonacci trading strategy.


