


The Stochastic Oscillator, a seasoned technical indicator, has assisted numerous traders in navigating the volatile waters of financial markets. However, like with any weapon, its ultimate strength resides in the hands of people who grasp its intricacies. So, whether you’re a seasoned veteran or a chart-curious novice, saddle up as we go into some advanced methods to unleash the full potential of this flexible indicator.
Stochastic Indicator: George Lane invented this technical indicator over 50 years ago. This oscillator has been around for a purpose.
It is because it continues to provide consistent messages even now.
What is the Stochastic Indicator and How Does It Work?
The Stochastic indicator is a momentum indicator that indicates the strength or weakness of the current trend. It aids in the identification of overbought and oversold market circumstances within a trend. Most trading systems should have the stochastic indicator freely accessible.
The Stochastic indicator looks like this:

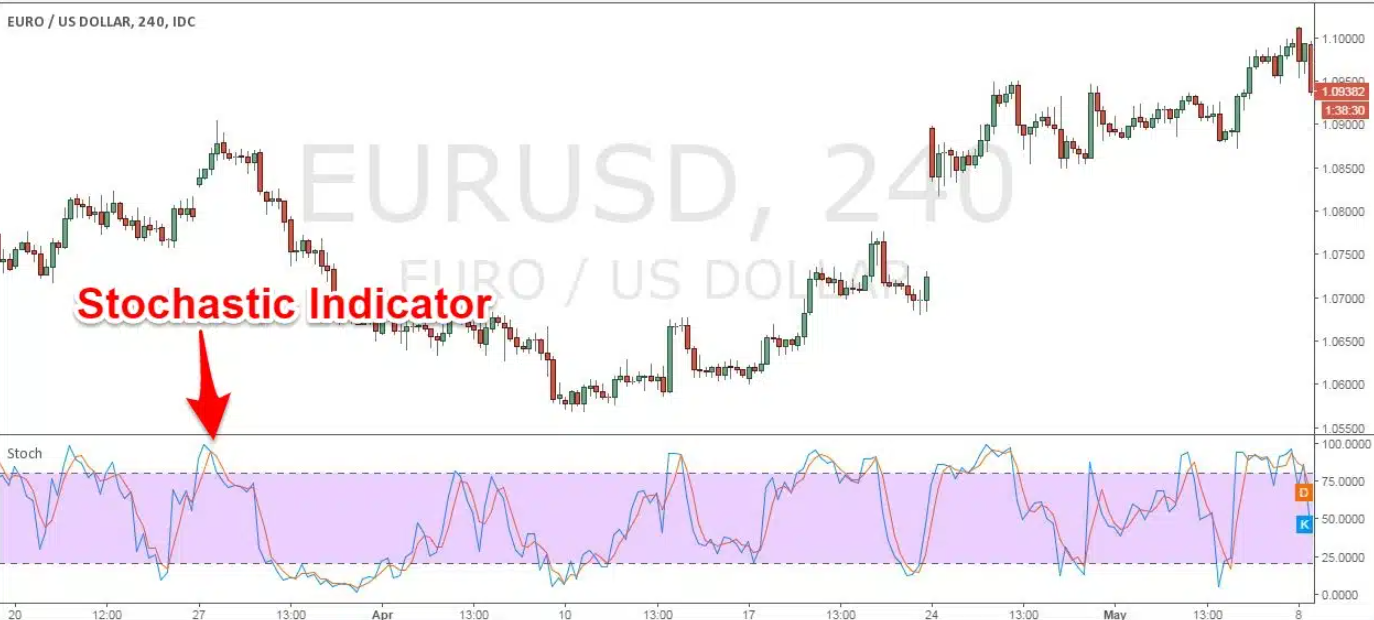
Source: Investopedia
Stochastic indicator formula
The stochastic indicator is calculated using the following formula:
%K = 100(C – L14) / (H14 – L14)
where:
C = the instrument’s most recent closing price
L14 = the instrument’s lowest price of the 14 days
H14 = the instrument’s highest price of the 14 days
Stochastics Construction
The modern or “Full Stochastics” oscillator combines elements of Lane’s “slow stochastics” and “fast stochastics” into three variables that control look-back periods and the extent of data smoothing.
- Fast K% – measures the closing price compared to specified lookback periods.
- Full K% or K% slows Fast K% with a Simple Moving Average (SMA).
- Full D% or D% adds a second smoothing average.
- Lower Fast K%, K% and D% variables = a shorter-term lookback period with less smoothing
- Higher Fast K%, K% and D% variables = a longer-term lookback period with greater smoothing
Choosing the Best Options
Decide how much noise you’re prepared to take in the data to determine the most successful factors for your trading strategy. Understand that no matter what you pick, the more experience you have with the indicator, the better your ability to recognize trustworthy indications. Short-term market participants prefer low settings for all variables because they receive early indications in the highly competitive intraday market. Long-term market timers often utilize high values for all variables since the highly smoothed output only reacts to significant price movements.
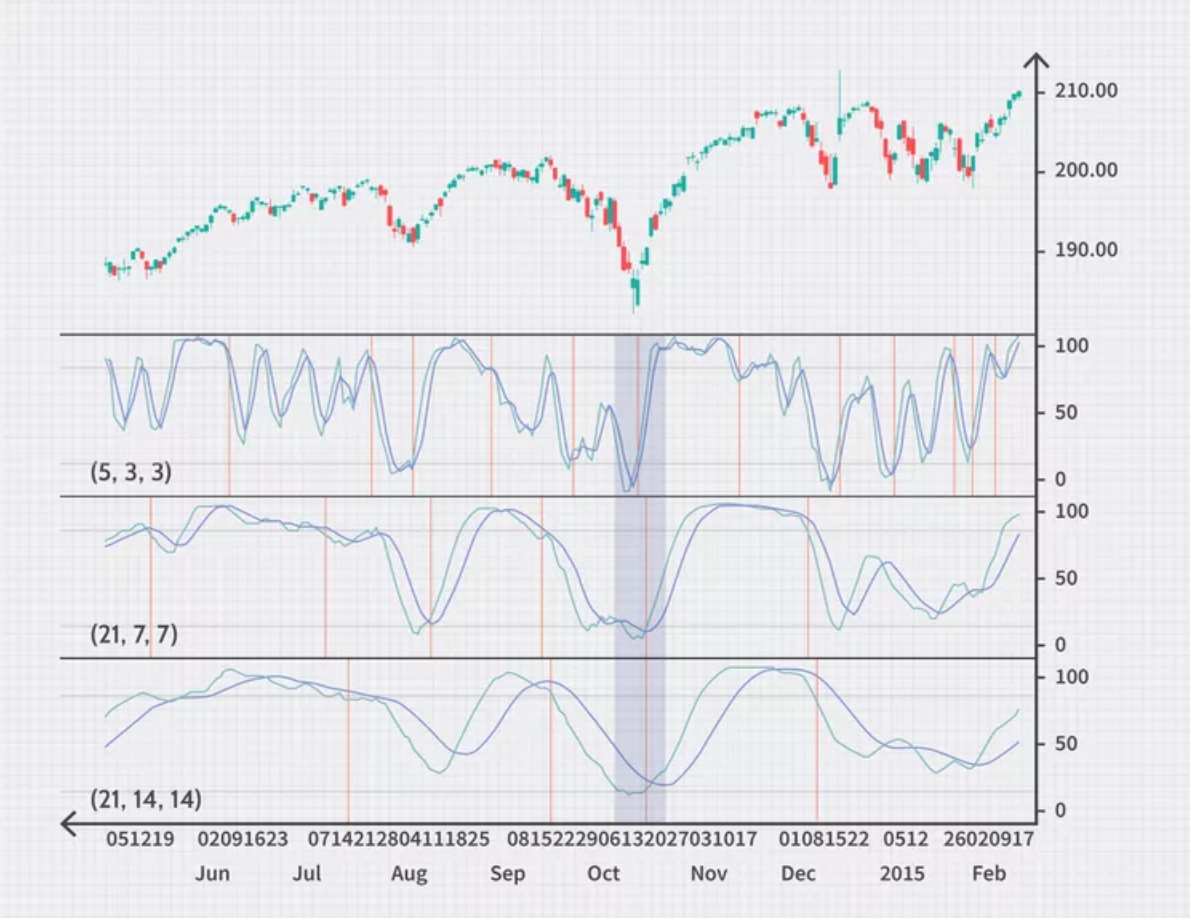
Source: Investopedia
Stochastics and Pattern Analytics
Stochastics do not have to reach severe levels to generate credible alerts, especially when the price pattern has natural obstacles. While the most significant turns are predicted at overbought or oversold levels, crossings in the panel’s middle can be trusted if significant support or resistance levels line up. Moving averages, gaps, trendlines, and Fibonacci retracements will frequently intervene, decreasing the duration of a cycle and shifting power to the opposite side. This emphasizes the necessity of reading the price trend when interpreting the indication.

Source: Investopedia
How to Effectively Utilize the Stochastic Oscillator
The stochastic oscillator is a powerful tool in technical analysis, offering various strategies for traders. Understanding its applications can enhance your ability to identify entry and exit points in the market.
Stochastic Overbought/Oversold Strategy
In this strategy, traders identify potential entry and exit points based on overbought or oversold conditions:
- Buy Signal: Look for a buy trade when the stochastic indicator rises above 20 after being below that level, signaling an oversold condition.
- Sell Signal: Consider a sell trade when the stochastic indicator falls below 80 after being above that level, indicating an overbought condition.

It’s crucial to note that overbought or oversold labels alone may not prompt immediate price movements. These conditions suggest the price is trading near the top or bottom of the range, and they can persist.
Stochastic Divergence Strategy
Traders often use the stochastic indicator to identify potential reversals in trends through divergence:
- Bullish Divergence: Occurs when the price makes a lower low, but the stochastic indicator hits a higher low, signaling a potential upward reversal.
Cc: Bullish divergence
- Bearish Divergence: This happens when the price makes a higher high, but the stochastic indicator reaches a lower high, suggesting a potential downward reversal.
Cc: Bearish divergence
Confirmation of divergence should be sought through an actual turnaround in the price, as divergence alone may not lead to immediate reversals.
Stochastic Crossover
This strategy involves observing crossovers between the %K and %D lines, particularly in overbought or oversold regions:
- Buy Signal: A rising %K line crossing above the %D line in an oversold region.
- Sell Signal: A falling %K line crossing below the %D line in an overbought region.
These signals are more reliable in a range-bound market than in a trending one. In a trend-following approach, traders monitor the stochastic indicator to confirm a sustained direction.
Stochastic Bull/Bear Strategy
Identifying bull and bear trade setups involves examining the relationship between the stochastic indicator and the instrument’s price:
- Bull Trade Setup: Stochastic makes a higher high while the price makes a lower high, indicating potential upward momentum. Traders may buy after a pullback when the stochastic drops below 50 and then rises again.
- Bear Trade Setup: Stochastic makes a lower low while the price makes a higher low, suggesting increased selling pressure. Traders may sell after a price rebound.
Despite its utility, traders should be aware of the stochastic indicator’s limitations, including potential false signals during choppy market conditions.
Using Stochastic Oscillator and RSI Together
To enhance your technical analysis, consider combining the stochastic oscillator with RSI. Watch the video below for insights on when and how to use these oscillators effectively. Understanding their differences and best practices can contribute to more informed trading decisions.
In conclusion
Many traders fail to tap into the power of Stochastics because they are confused about getting the right settings for their market strategies. These helpful tips will remedy that fear and help unlock more potential.
Staying mindful of the Stochastic Oscillator’s limitations, including potential false signals during choppy market conditions, is essential. In the dynamic world of trading, the Stochastic Oscillator serves as a reliable guide when wielded with a nuanced understanding of its intricacies. For those seeking an enhanced technical analysis toolkit, the combination of the Stochastic Oscillator with RSI offers a potent approach.
In the hands of a proficient trader, the Stochastic Oscillator becomes not just a tool but a key ally in navigating the complexities of the financial markets. So, as you embark on your trading journey, harness the power of the Stochastic Oscillator and elevate your trading prowess. May your charts be clear, and your trades be prosperous! Happy trading!!


