


Aroon indicator is a system developed by Tushar Chande in 1995. It shows whether a stock is trending and how strong the trend is. “Aroon” means “Dawn’s Early Light” in Sanskrit. In this article, we focus on answering the question, “What does the Aroon indicator do?” and presenting some Aroon indicator strategies.
It’s called Aroon because the endgame for this indicator is the reveal of a beginning in new trends. Chande certainly knew why he chose this name for it. Aroon also aimed to measure trends’ strength and duration, ultimately providing traders with valuable insights into potential trend patterns.
Read More: Mudrex Review 2024: Is it Legal in India?
Understanding the Aroon Indicator
The Aroon Indicator consists of two lines – the Aroon Up and Aroon Down. It’s also referenced as aroon up down indicator or Aroon up and down indicator. These lines oscillate between 0 and 100. Reflecting the percentage of time that has passed since the highest high and lowest low. They occur over a specific period, typically 25 periods. We will demonstrate some Aroon Indicator Strategy examples on the Quotex platform in the sections below.
Click here to sign up on Quotex for free and trade binary options
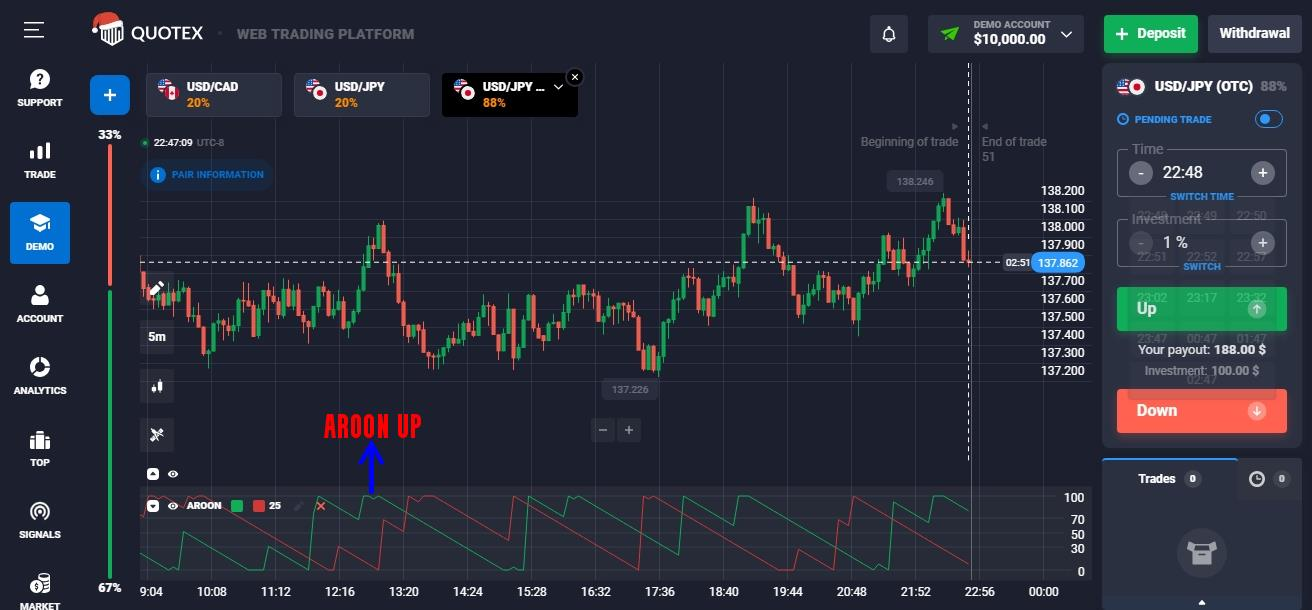
Aroon Up
The Aroon Up line counts the number of periods since the highest high in the chosen timeframe. A high Aroon Up value means the price consistently goes up, suggesting a bullish trend. If the Aroon Up is at 100%, it means the price is at its highest point in the given period, indicating a strong upward trend. On the other hand, If the Aroon Up is at 0%, it means the price hasn’t hit a new high recently. This could indicate a weakening or reversing trend.
Read More: IQ Option Review 2024: Is the Broker’s Popularity Justified?
Read More: CoinDCX Review 2024: The Best Crypto Exchange in India?
Aroon Down
Conversely, the Aroon Down line measures the number of periods since the lowest low. A high Aroon Down value suggests a strong bearish trend. While bearish, prices have a consistent downward momentum. Like the Aroon Up, the Aroon Down measures the exact opposite. It shows the time it takes for an asset’s price to reach its lowest point over a specific period, commonly 25 periods.
When at 100%, it indicates that the price has reached its lowest point. Suggesting a strong downward trend during that specified period. Conversely, if the Aroon Down is at 0%, it implies that the price hasn’t reached a new low within the given period. This could be a sign of a weakening or reversing trend. For traders to understand how to use an Aroon up and down indicator, they should know its main elements and nature.
Read More: How to Trade on the Quotex OTC Market: In-Depth Review

Read More: Obsignals Review: The Best Free Binary Options Signals Provider?
Aroon Indicator Signals
Traders can extract valuable data from the interaction between the Aroon Up Downlines. The oscillator itself contributes to the goal as well. Now, we try to understand how to extract the best Aroon indicator buy signal instructions.
Trend Strength
When Aroon Up is above Aroon Down, it suggests a prevailing bullish trend, and vice versa. The wider the gap between the two lines, the stronger the trend. Traders can use this information to assess the overall strength of the current trend.
Read More: How to Use the Envelope Indicator Strategy?

Trend Reversals With Aroon Indicator
A crossover of the Aroon Up and Aroon Down lines can indicate a potential trend reversal. For example, if Aroon Up crosses above Aroon Down, it may signal a shift from a bearish to a bullish trend. A crossover in the opposite direction may signal a shift from a bullish to a bearish point of view.
Read More: Soft4Fx Forex Simulator Review: The Most Popular Backtesting Software

Consolidation and Range-Bound Markets
When both Aroon Up and Down values are low, a lack of clear trend direction is observed. This scenario is often associated with consolidation or a range-bound market, which provides traders with insights into potential periods of price indecision. In some cases, there may even be upcoming volatility or breakout. A breakout could lead to a new trend forming, either upward or downward. The trend result depends on the direction of the breakout.
Read More: CloseOption Review 2024: One of the Most Popular Binary Options Brokers

Aroon Oscillator Indicator
The Aroon Oscillator indicator is derived by subtracting Aroon Down from Aroon Up. This oscillator moves around zero and shows how bullish or bearish the market is. Traders often use the Aroon Oscillator to identify potential trend changes. The observed trend changes are seen before manifesting in the price action. With the given information, a trader could plan a decent Aroon oscillator trading strategy.
Read More: A Complete Tutorial to the Fractal Trading Strategy
Extra aspects of using the Aroon indicator
What is the best strategy for Aroon? Aroon indicator can’t help you in optimizing your profit single-handedly. So, for the best Aroon indicator trading strategy, we should know how to optimize and backtest the indicator.
Confirming Trends with Price Action
Use the Aroon indicator in conjunction with price action to confirm trends. For instance, if prices reach higher highs and lows, a bullish trend is reinforced if Aroon-Up is also high. However, it should be mentioned that the rise in price highs and lows should be consistent as well.
Divergence and Convergence
Pay attention to the divergence and convergence between Aroon-Up and Aroon-Down. Divergence might signal a potential trend change. Divergence is when prices are moving in the opposite direction of Aroon lines.
Combining Aroon with Support and Resistance
Identify key support and resistance levels on the price chart. When Aroon signals a potential reversal near these levels, it adds weight to the analysis.
Using Aroon Indicator for Different Time Frames
What is the best period for Aroon? Aroon can be applied to various time frames (daily, weekly, hourly). Longer time frames may provide more reliable signals for long-term trends. On the other hand, shorter time frames can help with short-term trading.
Risk Management
Always incorporate risk management strategies. Aroon strategy can help you identify potential entry and exit points. Yet, to use the given data, setting stop-loss orders and defining risk tolerance is crucial.
Backtesting and Optimization
Before relying on Aroon in live trading, its performance should be evaluated. A backtest of historical data could be a good start. You can also optimize the indicator’s parameters to suit specific market conditions. Check out our articles about TraderEdge backtester or Best Forex Backtesting Software Tools in 2024.
Avoiding Overreliance on Aroon Indicator
While Aroon is a valuable tool, avoid relying on it exclusively. A comprehensive trading strategy should include technical and fundamental analysis tools, but not solely on Aroon.
Market Conditions
Understand that Aroon’s effectiveness can vary depending on market conditions. It might work well in trending markets, but it could also generate false signals in sideways or choppy markets.
Staying Informed
Stay updated on economic events and news that might affect the market. Sudden news releases or significant events can override technical signals. So when the question “Which is the world most accurate indicator?” is asked, we know that there isn’t one. Yet, you can achieve optimal performance by combining Aroon indicator with other ones. That’s basically the best Aroon indicator formula we could present.
Read More: Pocket Option Review 2024
Limitations of Using the Aroon Indicator
How accurate is the Aroon indicator? The Aroon indicator may sometimes signal a good entry or exit, but the signals are usually poor and false. The buy or sell signal may occur too late after a considerable price move has already occurred. This happens because the indicator is looking backward and isn’t predictive. A crossover may look good on the indicator, but that doesn’t mean the price will make a big move. The indicator isn’t factoring the size of moves. It only cares about the number of days of a high or low. Even if the price is flat, crossovers will occur as, eventually, a new high or low will be made within the last 25 periods.
For a trader to have an extensive market analysis, other indicators are essential. Furthermore, adjusting the timeframe can adjust the Aroon Indicator to different trading styles. Whether it’s short-term or long-term to make informed trading decisions. Solely relying on one indicator isn’t advised.
Click here to read our comprehensive guide to binary options trading.

Read More: How to Use the Free Pocket Option Demo Account?
Conclusion
In this article, we mainly answered the questions; “What is Aroon indicator?”, “How to use aroon indicator?” and “How to read aroon indicator?”. The Aroon Indicator is used as a valuable tool in a trader’s arsenal. It offers knowledge of trend strength and market consolidation. While no indicator is flawless, traders should understand how to interpret Aroon. The use of Aroon would make trading decisions much more informed in the financial markets.
For a technical analysis strategy to be great, it should consist of various indicators. This is basically the best Aroon indicator setting a trader could possess. It’s not wise to simply rely on the Aroon indicator alone. Risk management strategies would also help the journey to becoming a successful trader. Now it’s your turn to come up with your own personal Aroon indicator strategy to solidify your trading skills.
Read More: Comprehensive Quotex Review in 2024: Is it the Best Binary Options Broker?


