


Some of the most powerful moves in the financial markets occur when a trend builds. Once a trend takes hold, it may often exceed general expectations for how long it will persist, leaving only the most skilled traders to profit to the maximum.
Being able to properly analyze trending states of the market is therefore an extremely useful ability, which is exactly why there are so many different tools that attempt to do the job. This article is going to take a look into one of the major indicators in the area: the Parabolic SAR indicator.
- Origin and Development:
The Parabolic SAR was developed by J. Welles Wilder, the same mind behind other well-known indicators such as the Average True Range (ATR) and the Relative Strength Index (RSI).
Introduced in his book “New Concepts in Technical Trading Systems” in 1978, the Parabolic SAR was designed to help traders follow the trend and maximize profits during strong price movements.
- Calculation of the Parabolic SAR:
The Parabolic SAR uses the highest and lowest price as well as the acceleration factor to determine where the SAR indicator dot will be displayed. The formula for the Parabolic SAR is as follows:
Uptrend Parabolic SAR = Prior SAR + Prior AF (Prior EP – Prior SAR) Downtrend Parabolic SAR = Prior SAR – Prior AF (Prior SAR – Prior EP) Where:
- EP is the extreme point in a trend (highest point reached by a price during an uptrend or the lowest price reached during a downtrend).
- AF is the acceleration factor which is initially set to a value of 0.02 (it is increased by 0.02 each time the EP is recorded, with a maximum of 0.20). Traders can choose the acceleration factor depending on the trading style or instrument being traded).
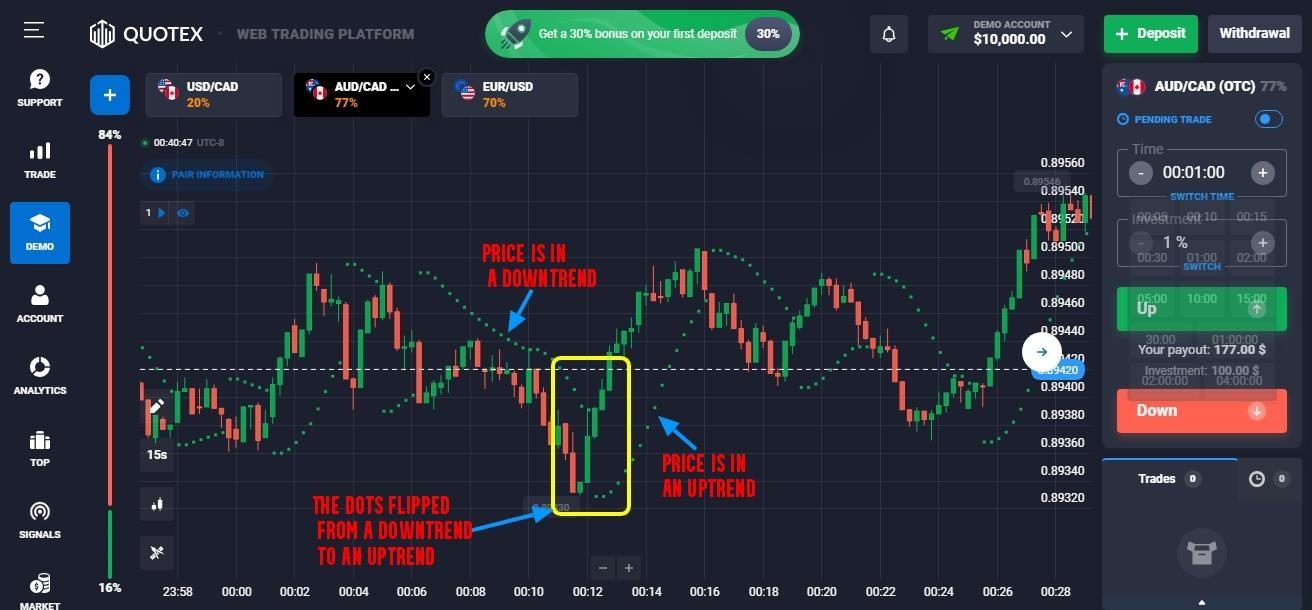
Results obtained from the calculations above create a dot that is plotted against the asset price action, either below or above it. The dots help to determine the current direction of the price. See the image below.

- Interpretation of the Parabolic SAR:
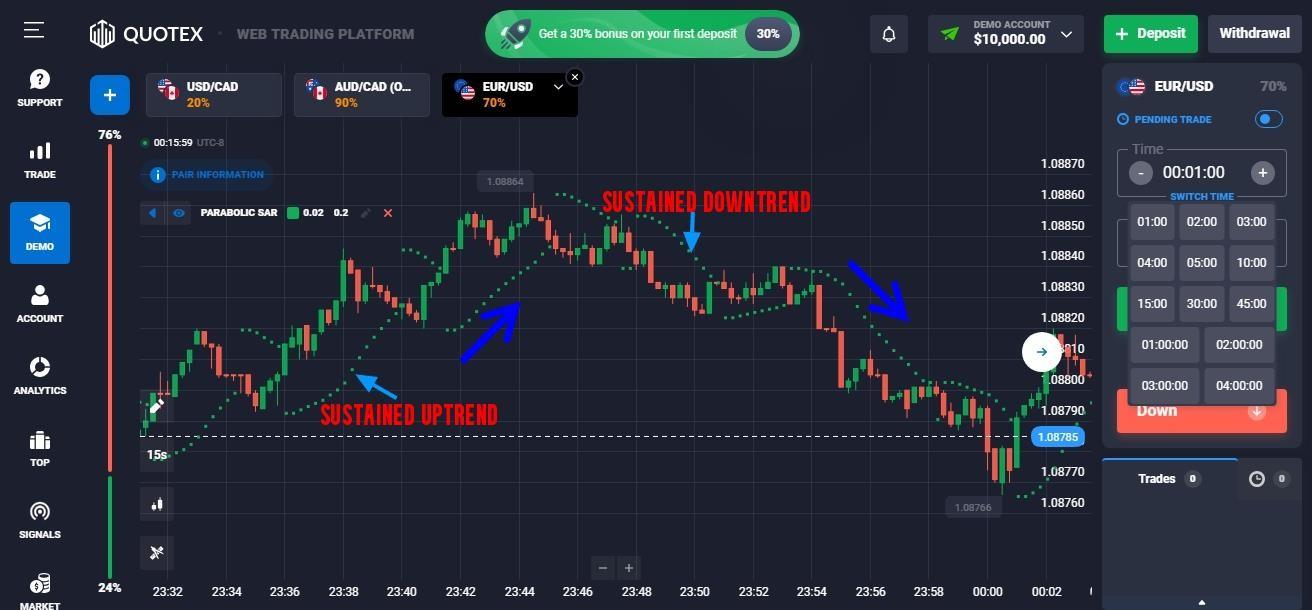
The Parabolic SAR appears as dots above or below the price chart, depending on the direction of the trend. When the dots are below the price, it signals an uptrend, and when the dots are above the price, it indicates a downtrend. The distance between the dots and the price provides a visual representation of the strength of the trend.
- Trend Reversal Signals: The most significant aspect of the Parabolic SAR is its ability to generate signals for potential trend reversals. When the SAR dots switch sides, it suggests a reversal may be imminent. For example, if the dots move from above to below the price, it could signal a shift from a downtrend to an uptrend.
- Acceleration Factor: The acceleration factor is a crucial parameter in the Parabolic SAR calculation. It starts at a predetermined value (commonly 0.02) and increases incrementally with each new extreme point. Traders can adjust this parameter based on their risk tolerance and the volatility of the asset being analyzed.
- Practical Applications:
- Trend Following: Traders often use the Parabolic SAR to follow trends and stay in winning trades for as long as possible. As long as the dots remain on one side of the price, it indicates a sustained trend.
- Stop-Loss Placement: The Parabolic SAR can be an effective tool for setting dynamic stop-loss orders. The idea is simply to exit a trade position when the parabolas flip to the other side of the price. As mentioned above, the optimal time to confirm a trend reversal is when three parabolas print on the opposite side of the price. This would be a signal to close out a trending position. As the SAR values adjust with the changing trend, traders can place their stop-loss orders just below the SAR dots in an uptrend or above the dots in a downtrend.

- Confirmation with Other Indicators: While the Parabolic SAR is powerful on its own, combining it with other technical indicators can enhance its effectiveness. Traders often use it in conjunction with oscillators, moving averages, or trendlines for a more comprehensive analysis.
- Which timeframe is best for Parabolic SAR?
The hourly, 4-hour, and daily time frames tend to be optimal for Parabolic SAR trading as they balance smoothing lower timeframe noise with timely, actionable signal generation. On smaller time frames like the 1-minute and 5-minute charts, the SAR’s sensitivity causes whipsaws and potentially premature entry/exit signals. The constant price changes on lower time frames reduce the indicator’s reliability.
At the other extreme, monthly and weekly charts are better for long-term trend analysis. The SAR sometimes lag price moves or flips infrequently on the extended timeframes. Its signals come too late to capitalize on short-term swings. The hourly, 4-hour, and daily timeframes provide an optimal environment for SAR trading. On these timeframes, the indicator identifies quality trend moves and reversals early enough to enter, trail stops, and exit with controlled risk and timed precision.
- Limitations of the parabolic SAR
While the Parabolic SAR is a powerful and widely-used indicator, like any technical tool, it has its limitations and potential drawbacks. Traders should be aware of the following cons when using the Parabolic SAR:
- Fixed Acceleration Factor:
The fixed acceleration factor in the Parabolic SAR can be a limitation. While it is designed to increase as the trend persists, some traders prefer indicators that adapt
more dynamically to changes in market conditions. Adjusting the acceleration factor manually may be necessary to better suit certain assets or timeframes.
- Dependency on Historical Data:
The Parabolic SAR relies heavily on historical price data for its calculations. While this is a common trait among technical indicators, it means that the indicator may not be as effective during periods of sudden and unexpected market events, such as economic releases or geopolitical developments.
- Not Applicable to All Securities:
While the Parabolic SAR can be effective in analyzing certain assets, it may not perform as well in all markets or securities. Traders should consider the characteristics of the specific asset they are trading and conduct thorough testing before relying solely on the Parabolic SAR for decision-making.
Conclusion
The Parabolic SAR indicator is a valuable tool for traders seeking to identify trends, potential reversals, and optimal entry and exit points in the financial markets. Its simplicity and effectiveness make it a popular choice among both novice and experienced traders. However, like any technical indicator, it is essential to consider other factors and use the Parabolic SAR in conjunction with additional analysis tools for a well-rounded approach to trading. As with any trading strategy, risk management remains paramount, and traders should thoroughly backtest and understand the indicator’s behavior before incorporating it into their trading plans. Happy trading!!


