


The Donchian Channel strategy was developed in the 1960s by Richard Donchian, a renowned American commodities and futures trader. Widely regarded as the Father of Trend Following Trading, his strategy is still popular among stock market traders for deciding whether to take a long or short position and for predicting emerging trends.
The Donchian Channel is considered one of the best trading indicators for intraday trading, providing a visual representation of a security‘s price variations over a given period that novice traders can easily understand. The indicator is primarily used by traders to identify trends, volatility, potential breakouts and retracements. A breakout is a rise in a security’s price above a resistance level (previous high) or a drop below a level of support (previous low). On the other hand, a retracement is when the price of a security starts to move back towards its previous price after a significant change.
Origins and Development:
The Donchian Indicator was developed by Richard Donchian, an American commodities trader and pioneer of technical analysis. Donchian is often considered one of the founding fathers of trend-following trading strategies. He introduced the concept of channel trading, which forms the basis for the Donchian Channel.
The indicator was initially applied to commodities markets but has since gained popularity across various financial instruments, including stocks, currencies, and cryptocurrencies.
Donchian’s innovative approach to market analysis has stood the test of time and remains relevant in modern trading.
Calculation of the Donchian Channel Indicator:
The indicator’s calculation is simple and uncomplicated, even for total beginners.The technique is usually determined by the number of periods you want to use. A 20-day term is commonly used by traders.
If we use that as an example, the indication will appear like this:
- 20-day Low in the Lower Channel 20-day High in the Upper Channel
- 20-day High + 20-day Low) / 2 Middle Channel
The method of calculating is straightforward. You must select the highest price for the provided period for the upper channel. Meanwhile, for the lower one, you choose the lowest price. The middle channel is the average of the two.
Components of the Donchian Channel:
The Donchian Channel consists of three key components:
- Upper Band: Represents the highest price over a specified period.
- Lower Band: Represents the lowest price over the same period.
- Middle Band: Calculated as the average of the upper and lower bands.
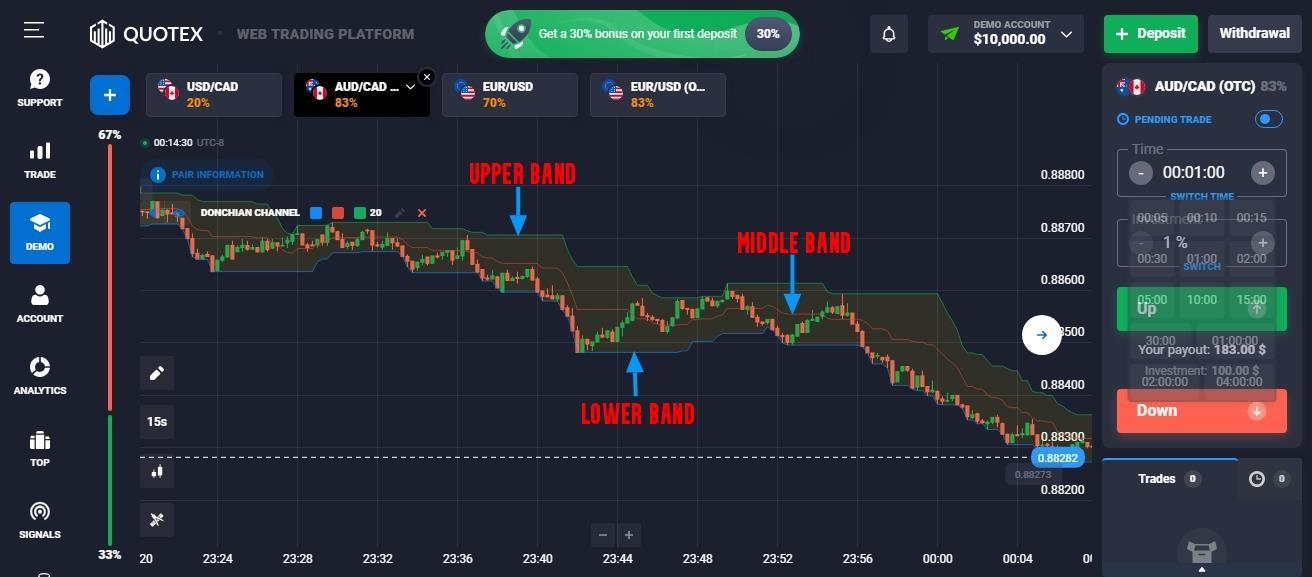
The most common parameter for the Donchian Channel is a 20-day period, but traders can adjust this setting based on their preferences and the timeframe of their analysis.
Interpretation of the Donchian Channel:
Traders use the Donchian Channel for various purposes, including trend identification, volatility measurement, and breakout signals.
- Trend Identification:
Donchian Channels are particularly useful for identifying trends. When the price consistently remains near the upper channel, it suggests a strong uptrend. Conversely, if the price hovers around the lower channel, it indicates a strong downtrend.

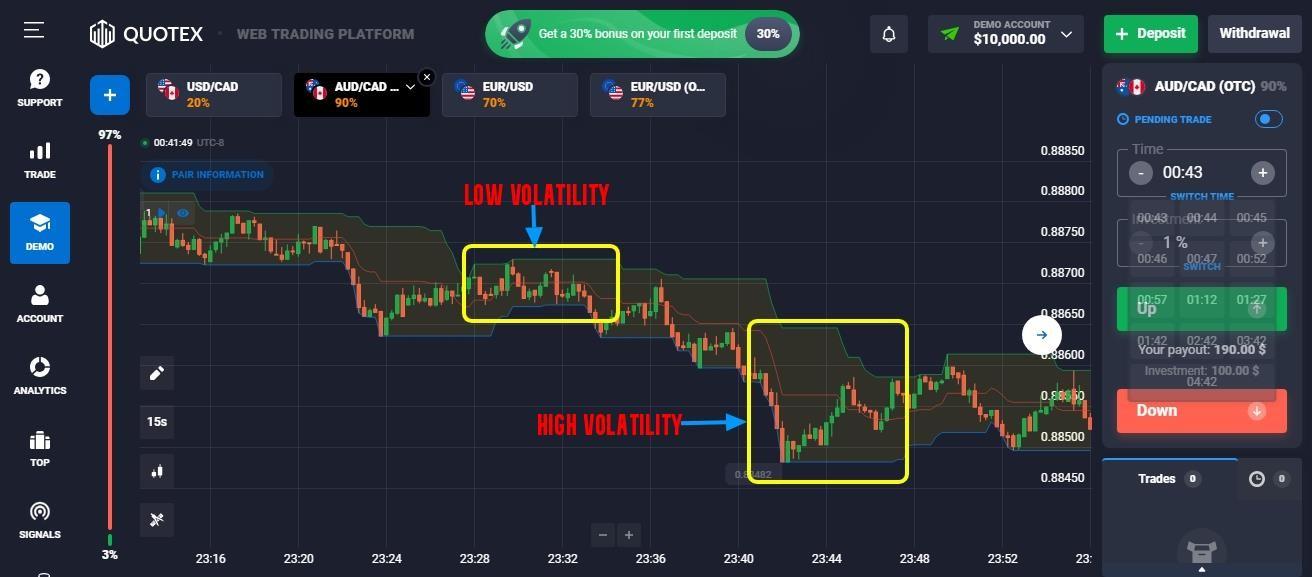
- Volatility Measurement:
The width of the Donchian Channels provides insights into the asset’s volatility. A broader channel implies high volatility, whereas a narrower channel signals low volatility.
- Breakout Signals:
Traders often use the Donchian Channel to identify potential breakout points. When the price touches the upper or lower bands, it simply means that the asset price is trading at its highs or lows for the last n periods. If it touches the upper band, that is a signal that a bullish breakout has occurred and traders should place buy orders. Likewise, if it touches the lower band, traders should seek to take advantage of a bearish breakout. However, it is important to wait for two consecutive candles to touch the outer bands to qualify a tradable breakout.
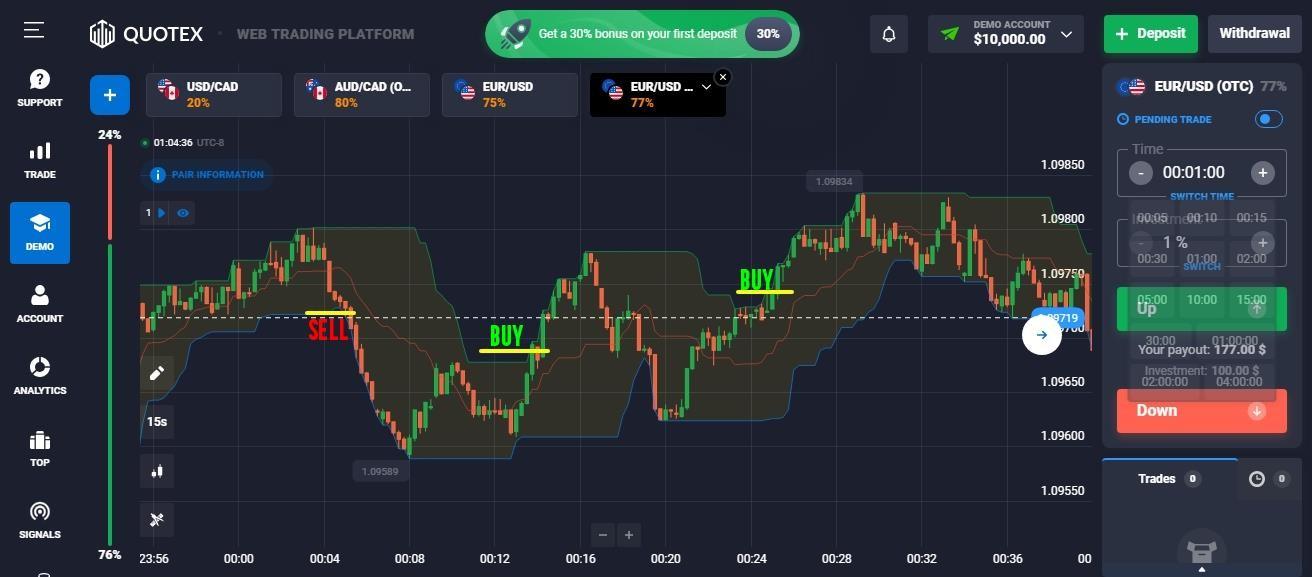
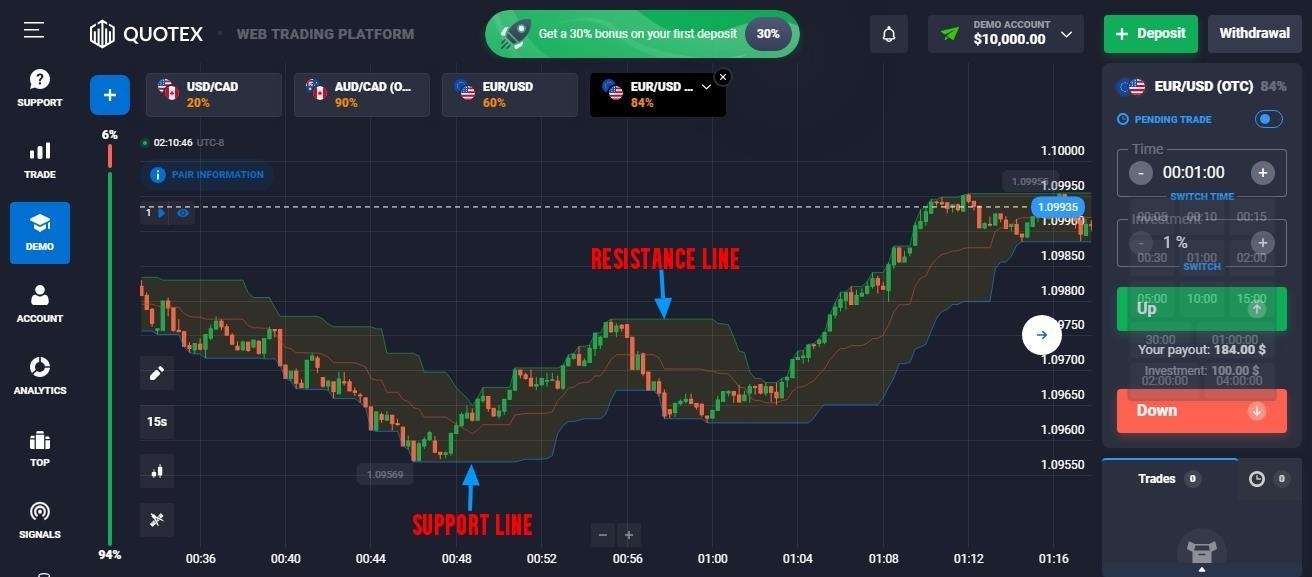
- Support and resistance:
The upper and lower channels can serve as dynamic support and resistance levels. Traders may consider buying when the price touches the lower channel and selling when it touches the upper channel.
- Stop loss placement:
Donchian Channels can be used to set stop-loss orders. Traders may place a stop-loss order slightly below the lower channel in an uptrend or slightly above the upper channel in a downtrend to limit potential losses.
Different Ways to Use Donchian Channels in Trading:
- Combining with Other Indicators:
The Donchian Channel is most effective when used in conjunction with other technical indicators. Combining it with trend indicators, such as moving averages, or oscillators like the Relative Strength Index (RSI) can enhance its reliability. For instance, confirming a Donchian breakout with an RSI reading can add confidence to a trading decision. Traders should always consider multiple indicators to obtain a comprehensive view of market conditions.
- Using Multiple Timeframes:
To gain a more comprehensive understanding of market trends and potential reversals, traders often utilize the Donchian Channel across multiple timeframes. For example, combining a daily Donchian Channel with a shorter-term, intraday channel can provide a
broader perspective on price movements. This multi-timeframe analysis allows traders to align their strategies with both short-term and long-term trends.
- Backtesting and Optimization:
Before incorporating the Donchian Channel into a live trading strategy, it is crucial to conduct thorough backtesting and optimization. This involves applying the indicator to historical price data to evaluate its performance under different market conditions. By identifying strengths and weaknesses through backtesting, traders can refine their strategies and improve the overall robustness of their trading approach.
Pitfalls and Considerations:
While the Donchian Channel is a powerful tool, it is not without limitations. Traders should be aware of false signals, especially during periods of low volatility when the price may hover around the middle band without clear trend direction. Additionally, like any indicator, the Donchian Channel is not foolproof and should be used in conjunction with other analysis methods and risk management strategies to maximize its effectiveness.
Conclusion
Donchian Channels are a valuable tool in technical analysis, offering insights into trends, volatility, and potential breakout opportunities. Traders and investors can use these channels to make informed decisions and manage risk effectively. By understanding the formula, calculations, and practical uses of Donchian Channels, individuals can incorporate this indicator into their trading strategies to enhance their decision-making in the financial markets. However, like any technical tool, it is essential to use Donchian Channels in conjunction with other indicators and perform thorough analysis before making trading decisions. Happy trading!!


