


The moving average is a technical indicator that market analysts and investors may use to determine the direction of a trend. It sums up the data points of a financial security over a specific time period and divides the total by the number of data points to arrive at an average. It is called a “moving” average because it is continually recalculated based on the latest price data. This indicator is a crucial component of technical analysis, providing valuable insights into the overall direction of an asset’s price movement. In this article, we will delve into the intricacies of the Moving Average indicator, exploring its types, calculations, interpretation, and practical applications in trading.
Types of Moving Averages:
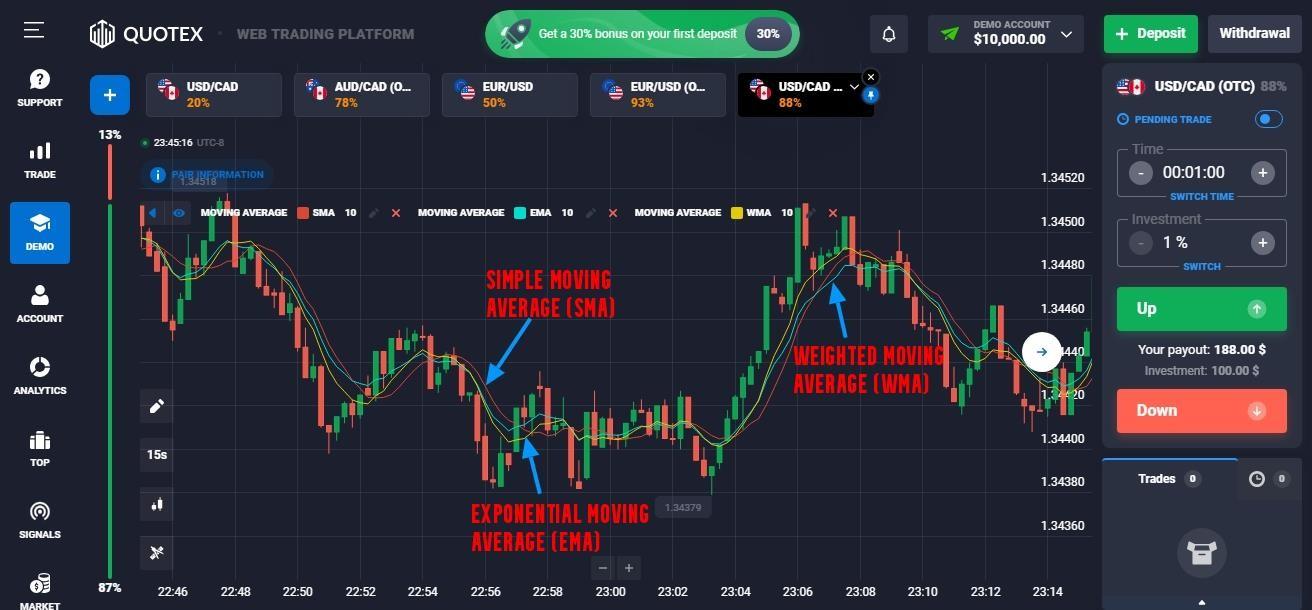
- Simple Moving Average (SMA):
The Simple Moving Average is the most straightforward type of moving average. It calculates the average price over a specified period, giving equal weight to each data point in the series. The formula for SMA is:
Simple Moving Average:
SMA =![]()
Where:
A= is each of the data points n = Number of time periods
- Exponential Moving Average (EMA):
The Exponential Moving Average places more weight on recent prices, making it more responsive to the latest market developments. The formula for EMA involves applying a multiplier to the previous day’s EMA. It is calculated using the formula:
EMA =![]()
Where:
EMAt= EMA today Vt= Value today EMAt = EMA today
s =smoothing
d = number of days
Steps for calculating EMA:
- Calculate the SMA for the particular time period
- Calculate the multiplier for weighting the EMA using the formula:
[2 ÷ (selected time period + 1)]. So, for a 10-day moving average, the multiplier would be [2/(10+1)]= 0.01818.
- Use the smoothing factor combined with the previous EMA to arrive at the current value.
- Weighted Moving Average (WMA):
The Weighted Moving Average assigns different weights to each data point, allowing traders to emphasize certain periods. While less commonly used than SMA and EMA, WMA can be customized based on specific market conditions.
Calculation and Interpretation:
The choice between SMA, EMA, or WMA depends on the trader’s objectives and time horizon. Short-term traders may prefer the EMA for its responsiveness, while long-term investors might opt for the smoother SMA. The interpretation of moving averages involves understanding their crossovers, trends, and potential signals.
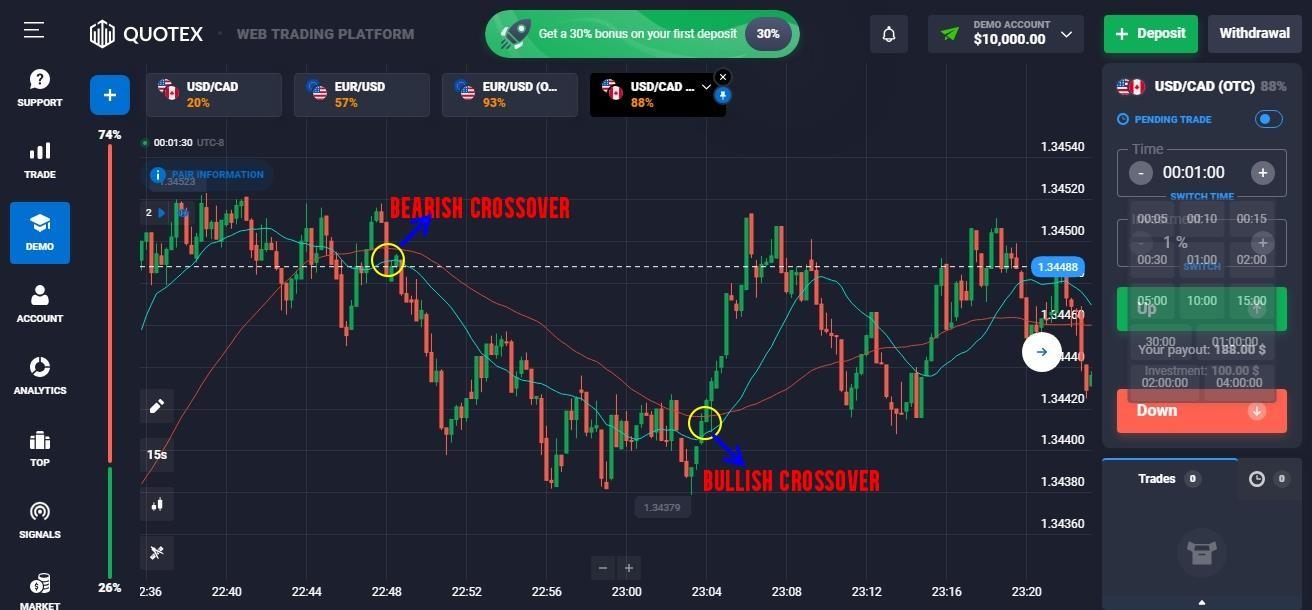
- Crossovers:
Crossovers occur when the price of an asset crosses above or below its moving average. A bullish crossover, where the price rises above the MA, may signal an upward trend, while a bearish crossover suggests a potential downtrend. Traders often use the 50-day and 200-day SMAs to identify long-term trends.
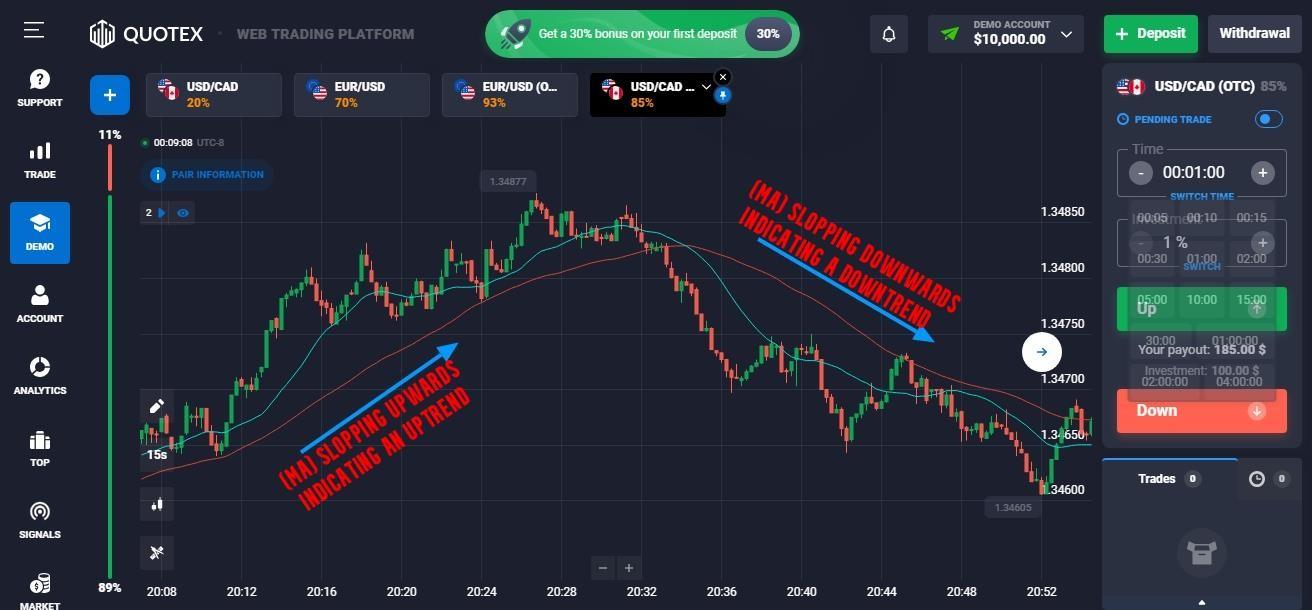
- Trend Identification:
The direction of the moving average itself can indicate the overall trend. If the MA is sloping upward, it suggests an uptrend, while a downward slope indicates a potential downtrend.
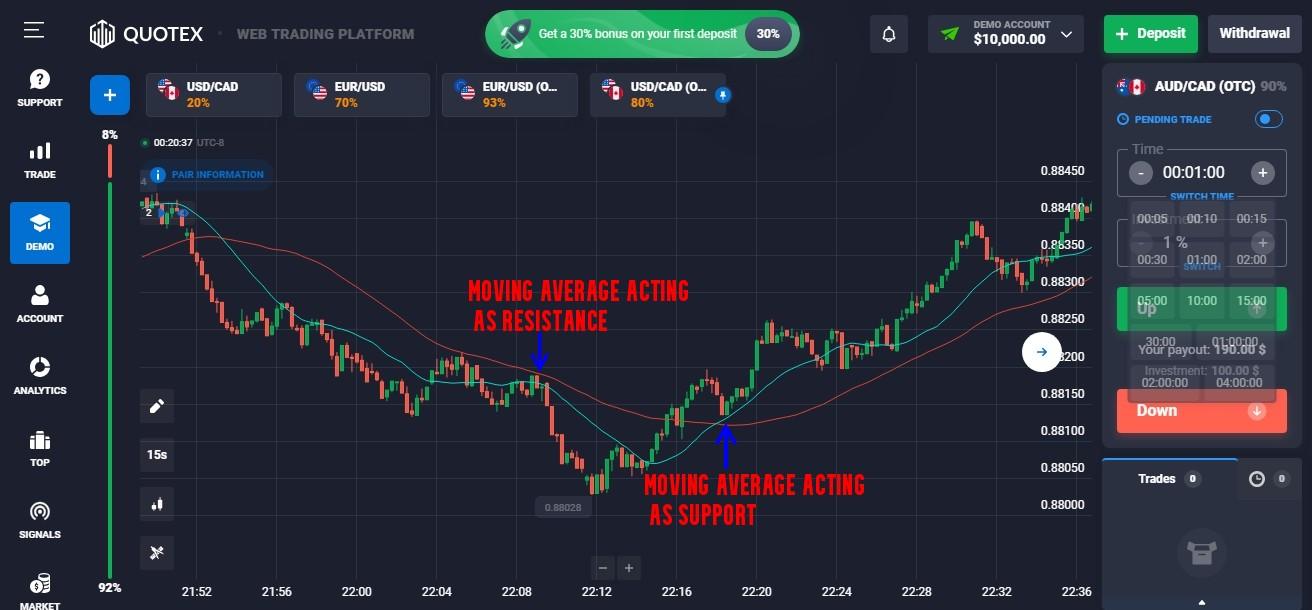
- Support and Resistance:
Moving averages can act as dynamic support or resistance levels. In an uptrend, the MA may provide support, and in a downtrend, it may act as resistance. Traders look for price bounces or breakouts at these levels.
Practical Applications in Trading:
- Trend Following:
Moving averages are commonly used by trend-following traders to identify and follow the prevailing market trend. They enter long positions during uptrends and short positions during downtrends.
- Signal Generation:
Trading signals are generated based on crossovers, where buying signals arise from bullish crossovers and selling signals from bearish crossovers. Traders often combine multiple moving averages to refine their strategies.
- Risk Management:
Moving averages help traders set stop-loss levels and manage risk. By identifying key support and resistance levels, traders can place stop-loss orders to limit potential losses in case the market moves against them.
Extended Analysis of the Moving Average Indicator:
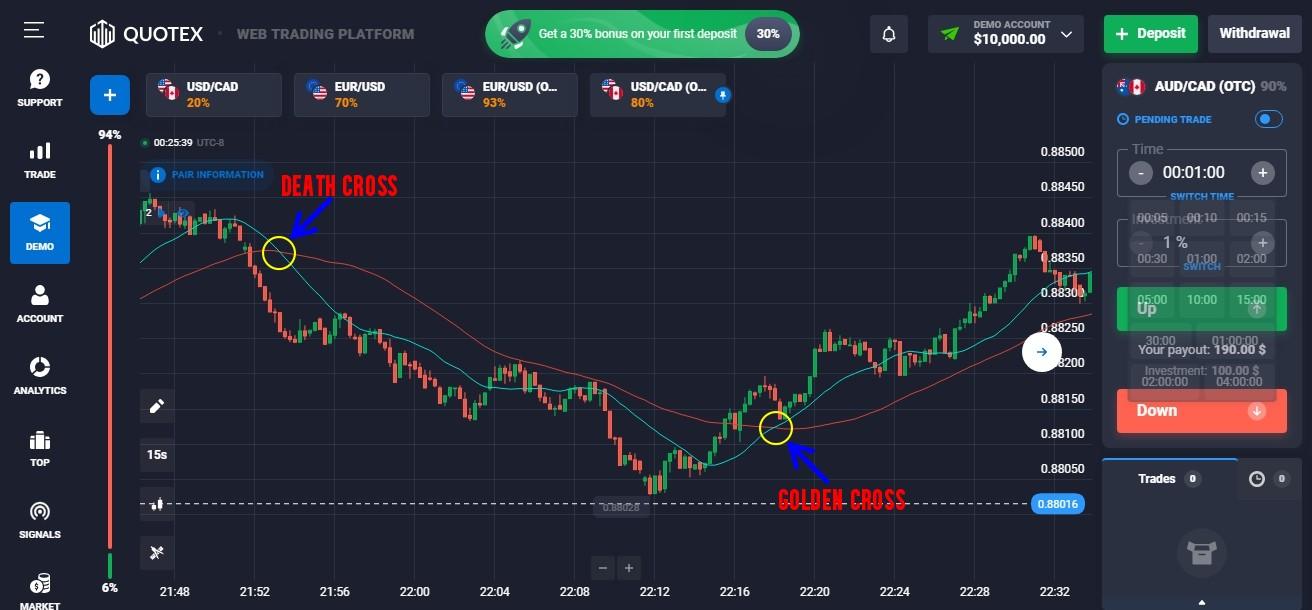
- Golden Cross and Death Cross:
A significant aspect of moving averages is the concept of the Golden Cross and Death Cross. The Golden Cross occurs when a shorter-term moving average crosses above a longer-term moving average, typically the 50-day SMA crossing above the 200-day SMA. This is considered a bullish signal, indicating a potential upward trend.
Conversely, the Death Cross occurs when the shorter-term moving average crosses below the longer-term moving average, signaling a potential downtrend.
- Moving Average Convergence Divergence (MACD):
The Moving Average Convergence Divergence is a trend-following momentum indicator that incorporates two moving averages – the MACD line and the signal line. Traders often use the MACD histogram to identify changes in a trend’s strength. A positive histogram indicates increasing bullish momentum, while a negative histogram suggests growing bearish momentum.
- Timeframe Considerations:
Traders should carefully choose the timeframe for their moving averages based on their trading style. Short-term traders might use shorter periods, such as 10 or 20 days, to capture more immediate price movements. In contrast, long-term investors may use longer periods, like 50 or 200 days, to filter out short-term noise and focus on broader trends.
- Market Volatility and Moving Averages:
Volatile markets can lead to false signals with moving averages. During choppy or sideways markets, prices may frequently cross above and below the moving average, generating unclear signals. It’s crucial for traders to consider the market conditions and use additional technical indicators to confirm signals.
- Combining Moving Averages with Other Indicators:
Moving averages work well when combined with other technical indicators. For instance, combining the Relative Strength Index (RSI) or the Moving Average Convergence Divergence (MACD) with moving averages can provide a more comprehensive view of market conditions, helping traders make more informed decisions.
- Adaptability to Different Assets:
The Moving Average indicator is not limited to stocks; it is widely used in various financial markets, including forex, commodities, and cryptocurrencies. Traders can adapt the indicator to different asset classes, adjusting the timeframes and parameters to suit the unique characteristics of each market.
- Backtesting and Optimization:
Traders often engage in backtesting strategies involving moving averages to assess historical performance and optimize parameters. This process involves testing different combinations of moving average periods and types to find the settings that would have produced the most profitable results in the past. However, it’s important to note that past performance does not guarantee future results.
Limitations and considerations of the moving average:
While the Moving Average (MA) indicator is a valuable tool in technical analysis, it comes with limitations and considerations that traders should be aware of. Understanding these factors is essential for using MAs effectively and avoiding potential pitfalls. Here are some key limitations and considerations:
- Whipsaws in Sideways Markets:
In sideways or ranging markets, where prices fluctuate within a narrow range, MAs can generate false signals known as “whipsaws.” During these periods, crossovers may occur frequently without a clear trend direction, leading to potentially misleading signals for traders.
- Not Suitable for Choppy Markets:
Choppy or erratic markets may result in frequent crossovers, making it challenging to distinguish between genuine trend changes and noise. Traders should exercise caution and consider additional confirmation tools when markets lack clear direction.
- Doesn’t Consider Market News and Events:
Moving averages solely rely on historical price data and do not take into account external factors such as economic news, geopolitical events, or corporate developments. Sudden market shocks or unexpected news can lead to price movements that MAs might not anticipate.
- Optimization Bias:
Traders often fall into the trap of optimizing moving average parameters based on historical data. While backtesting can be a useful tool, over-optimization may lead to curve-fitting, where a strategy fits historical data too closely and performs poorly in real- market conditions.
- Not Effective in Trend Reversals:
MAs may not be the most effective tool for identifying trend reversals. During strong trends, prices can remain above or below the moving average for an extended period, potentially causing traders to miss early reversal signals.
- Dependency on Chosen Timeframe:
The effectiveness of moving averages is highly dependent on the chosen timeframe. Different timeframes can produce conflicting signals, and traders may need to adjust parameters to fit their specific trading style and objectives.
- False Sense of Security:
Relying solely on moving averages without considering other technical indicators or fundamental analysis may give traders a false sense of security. It’s crucial to use MAs as part of a broader analytical approach.
- Not Always Suitable for Short-Term Trading:
While exponential moving averages (EMAs) can provide more responsiveness, moving averages, in general, may not be the best choice for very short-term trading. Traders focusing on intraday movements may need to complement MAs with other indicators.
Conclusion
The Moving Average indicator is a versatile tool that plays a crucial role in technical analysis. Traders and investors use it to identify trends, generate signals, and manage risk effectively. The Moving Average indicator, despite its widespread use and versatility, is not without its limitations. Traders should approach its application with a clear understanding of its lagging nature, potential for false signals, and dependency on market conditions. Combining MAs with other technical indicators and incorporating fundamental analysis can enhance the overall effectiveness of a trading strategy. Additionally, traders should remain cautious about over- optimization and always consider the broader market context when interpreting moving average signals.


