


Options trading is a financial venture that requires a strategic approach for success. One of the strategies that can help you make informed trading decisions is the moving average strategy.
Moving averages are a key technical analysis tool widely used in various financial markets, including options trading. They provide traders with a reliable way to interpret and understand market trends, making them an invaluable asset in decision-making processes.
In this article, we will explore what moving averages are in options trading, including the different types of moving averages and how to set up the indicator.
What is a Moving Average in Options Trading?
A moving average is a widely used technical analysis tool that helps traders identify trends and potential reversal points in the price of an underlying asset. This tool smoothens out price data to create a single flowing line, providing a clearer picture of the overall trend direction.
Traders use moving averages to filter out market noise and focus on the underlying trend, thereby helping them make informed trading decisions.
Moving averages are useful in options trading because they offer a visual representation of price trends, making it easier for traders to spot potential entry and exit points.
READ: Relative Strength Index Trading Strategy
How the Binary Options Moving Average Strategy Works
Here’s a breakdown of how the binary options moving average strategy works:
Trend identification
One of the main objectives of the moving average strategy is to identify trends in the price movement of an underlying asset.
Traders use different types of moving averages to achieve this, including simple moving averages (SMA), exponential moving averages (EMA), and linear weighted averages (LWA).
Crossover signals
A key aspect of the strategy involves analyzing the crossovers between different moving averages.
Crossovers occur when a short-term moving average crosses above or below a longer-term moving average. These crossovers signal potential changes in the direction of the trend.
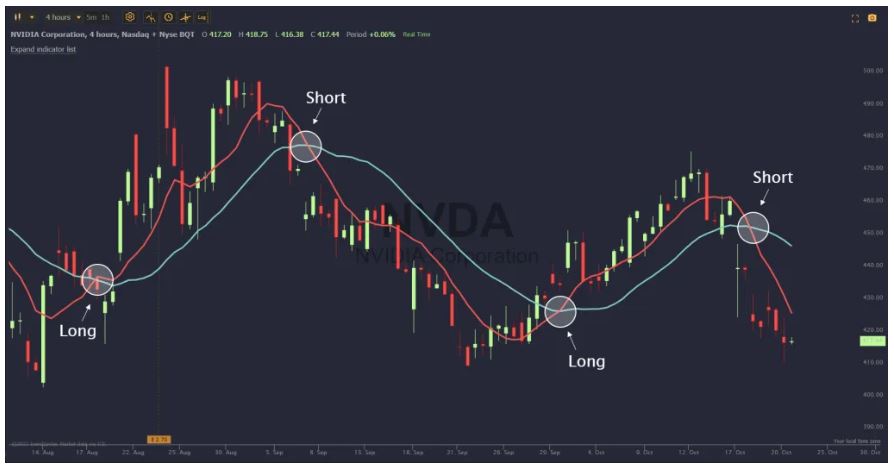
From the chart above, when the shorter-term moving average (red line) crosses above the longer-term moving average (blue line), it is a buy signal (i.e., long). On the other hand, when the red line crosses below the blue line, it is a sell signal (i.e., short).
Confirmation with price action
Successful implementation of the binary options moving average strategy involves confirming signals with other technical indicators and price action.
Traders often look for additional evidence, such as support and resistance levels, to strengthen the validity of a trading signal provided by moving averages.
READ: Moving Average Convergence Divergence (MACD) Trading Strategy
Types of Moving Averages
There are several types of moving averages, each with its own features and applications in the options market. Understanding these differences is essential for implementing a successful moving average strategy.
Here are the three main types:
Simple moving average (SMA)
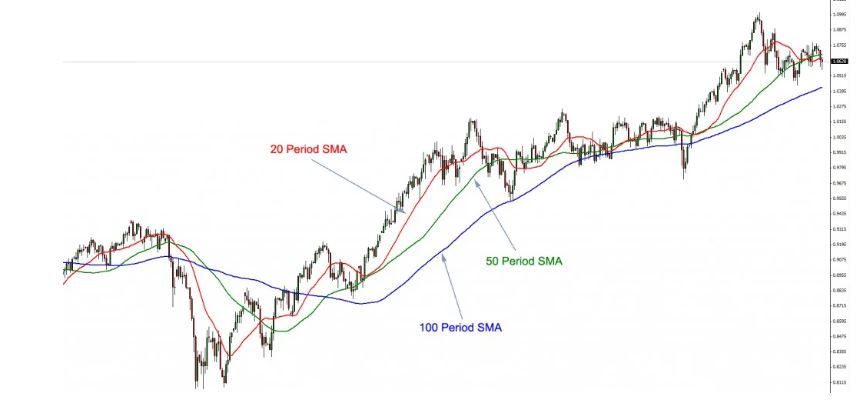
The Simple Moving Average is the most straightforward type of moving average. It is calculated by summing up a set number of closing prices and then dividing the total by the number of periods considered.
SMA provides equal weight to all data points within the chosen period, making it a reliable indicator for identifying overall trends.
Exponential moving average (EMA)
The Exponential Moving Average is a more dynamic indicator that gives greater weight to recent prices. It assigns exponentially decreasing importance to older data points, reflecting a faster response to recent market changes.
EMA is more responsive to recent price movements, making it suitable for traders who want to capture short-term trends and react quickly to market changes.
Linear weighted average (LWA)
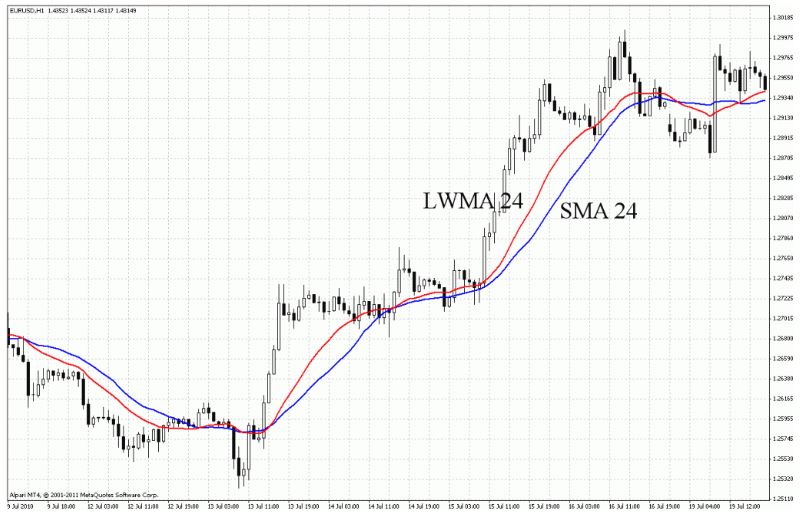
The Linear Weighted Average assigns different weights to each closing price within the selected period, with the most recent prices given the highest weight.
LWA emphasizes the significance of recent data while still considering historical prices, offering a balance between SMA and EMA characteristics.
Simple vs Exponential Moving Averages: Which Type is Better?
Simple moving averages (SMA) and exponential moving averages (EMA) are widely used in options trading. Understanding the differences between these moving averages will help you choose the most effective strategy.
Here are the main differences between simple and exponential moving averages:
Simple moving average
The Simple Moving Average is a straightforward calculation that provides a smoothed representation of price movements over a specified period.
It is derived by summing up the closing prices for a set number of periods and dividing the total by the number of periods considered. The result is a continuous line that reflects the average price over time.
Advantages
- SMAs are excellent at smoothing out price fluctuations, making it easier for traders to identify overall trends.
- The simplicity of the calculation makes SMAs easy to understand and implement.
Disadvantages
- SMAs can be slower to respond to recent price changes, leading to delayed signals in volatile markets.
- Each data point is given equal weight, which may not be ideal for capturing the latest market sentiment.
Exponential moving average
The Exponential Moving Average places greater emphasis on recent price data. Unlike the SMA, the EMA assigns different weights to prices, with more significance given to the most recent data points. This results in a faster response to changes in market conditions.
Advantages
- EMAs react swiftly to recent price changes, making them more responsive to current market conditions.
- Assigning more weight to recent prices allows EMAs to capture shifts in sentiment more effectively.
Disadvantages
- The heightened responsiveness can lead to more false signals in choppy or erratic markets.
- The calculation involves more complexity compared to the SMA, potentially posing challenges for some traders.
The choice between SMA and EMA depends on your preferences, risk tolerance, and specific market conditions. SMA is usually preferred due to its simplicity and reliability in trending markets, while EMA is preferred in dynamic markets due to its quick responsiveness.
In a nutshell, there is no one-size-fits-all answer to whether SMA or EMA is better for options trading. Traders often experiment with both and adapt their strategies based on the prevailing market conditions.
How to Set Up Moving Averages for Options Trading
Many brokers offering technical analysis tools for binary options simplify the process of setting up a moving average indicator. You can navigate to the platform’s indicators menu and select the Moving Average option.
Consider the Pocket Option interface below:
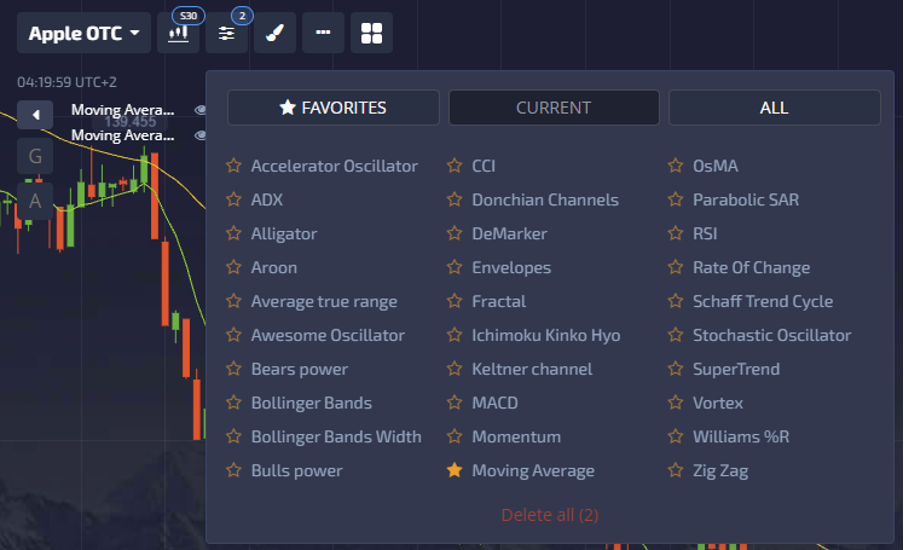
Next, customize your preferred moving average type and the desired period. Additional options might involve changing the line color, and in many cases, you can configure multiple MA indicators simultaneously.
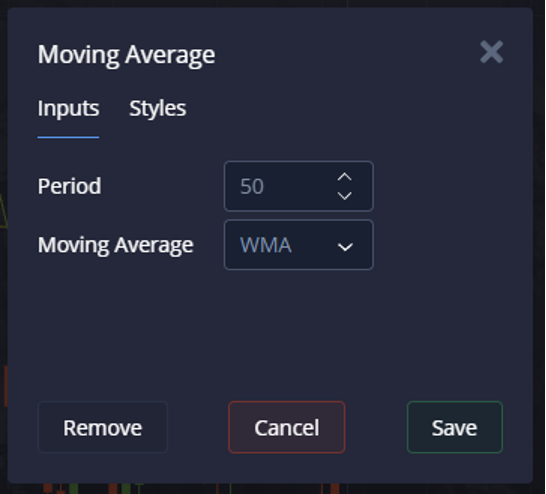
Click ‘Save’ once you’re through and the moving average will be added to your chart.
READ: Pocket Option Broker Review
Conclusion
Mastering the moving average strategy can be a game-changer for options traders who want to improve their decision-making processes. Throughout this article, we explored the fundamental concepts of moving averages in options trading. When combined with care and expertise, the moving average strategy can contribute significantly to your success in the options market. As with any trading strategy, continuous learning, adaptability, and a disciplined approach are key to unlocking its full potential. Happy Trading!!


