


In the dynamic realm and ever-changing of financial markets, traders and investors are constantly seeking tools that can provide insights into market trends and potential entry or exit points. One such popular technical indicator is the Moving Average Convergence Divergence (MACD) it is one of the most potent technical tools in the arsenal of many traders. This article delves into the intricacies of MACD, examining its origins, components, and effectiveness as a tool for technical analysis. It was developed by Gerald Appel in the late 1970s, MACD is a trend-following momentum indicator that aims to reveal the relationship between two moving averages of an asset’s price.
The indicator consists of three main components:
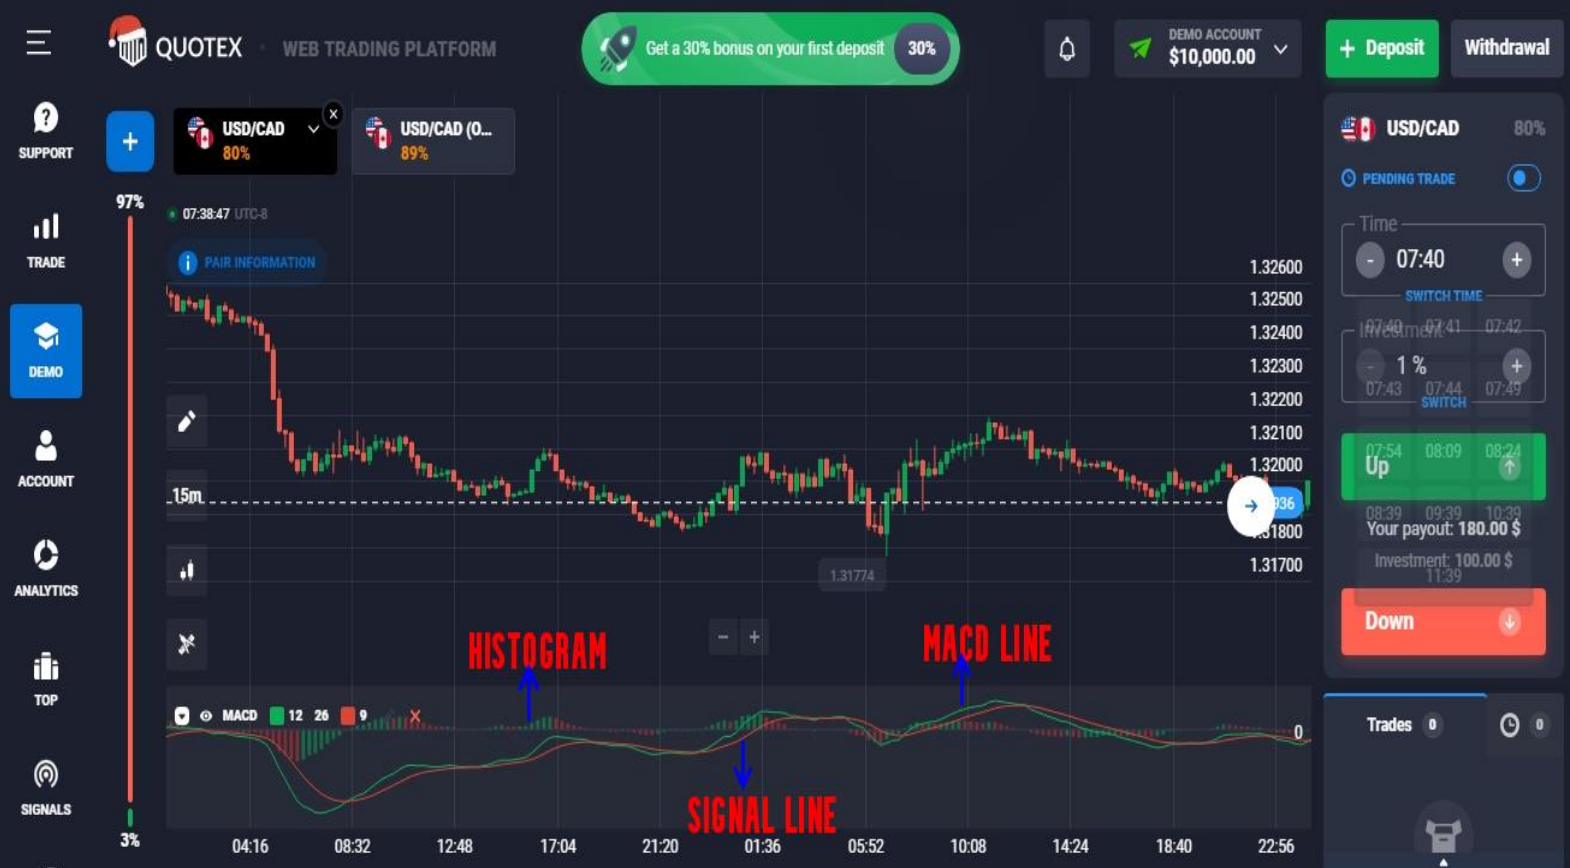
1. MACD Line: The MACD line is the difference between a short-term exponential moving average (EMA) and a longer-term EMA. It represents the momentum of a financial instrument.
2. Signal Line: The signal line, often referred to as the trigger line, is a smoothed average of the MACD line. Typically, a 9-period EMA is applied to the MACD line to generate the signal line.
3. Histogram: The histogram is a visual representation of the difference between the MACD line and the signal line. It provides a quick snapshot of the strength and direction of a trend
.
1. MACD Line and Signal Line: The MACD Line is at the core of this indicator, representing the difference between short-term and long-term exponential moving averages. The 12-period and 26-period EMAs are commonly used, providing a balance between sensitivity to short-term price movements and resilience to noise. The Signal Line, a 9-period EMA of the MACD Line, acts as a trigger for potential buy or sell signals. When the MACD Line crosses above the Signal Line, it generates a bullish signal, indicating that the asset’s momentum may be shifting upwards. Conversely, a bearish crossover suggests a potential downtrend.
- The space between the MACD When the two MACD indicator lines separate, it means that momentum is increasing, and the the trend is getting stronger. When the two MACD lines are coming closer together, it shows that the price is losing strength
Furthermore, we can use the 0-line as a trend tiebreaker. When the two MACD lines are above the 0-line, the price can be considered in an uptrend. And when the two MACD lines are below the 0-line, the price is in a downtrend.

2. MACD Histogram: The MACD Histogram is derived from the difference between the MACD Line and the Signal Line. It provides a visual representation of the relationship between the two lines, making it easier for traders to interpret momentum changes.
- Rising Histogram: Indicates that the MACD Line is pulling away from the Signal Line, suggesting increasing bullish momentum.
- Falling Histogram: Suggests that the MACD Line is converging towards the Signal Line, potentially signaling a weakening trend. Traders often look for histogram peaks and troughs to anticipate changes in trend strength. While some traders have unique MACD histogram settings, you are better off sticking to the default settings. This is because the market is an ever-changing platform. Even though you found a setting that works today does not mean it will be effective tomorrow. So the best way to make the most out of the MACD histogram isn’t to optimize the settings but rather to look at the signals produced from the default settings and learn how to go from there.

3. Divergence Analysis: Divergence occurs when the price of an asset and the MACD indicator move in opposite directions. This can be a powerful signal for potential trend reversals.
- Bullish Divergence: Occurs when the price makes new lows, but the MACD does not. This can signal that the selling pressure is weakening, potentially indicating an upcoming upward reversal.
- Bearish Divergence: This happens when the price makes new highs, but the MACD does not follow. This could indicate weakening buying pressure and a potential downturn. In the charts below, you can see an example of both types.


4. Overbought and Oversold Conditions: The MACD can be used to identify extreme conditions in the market, indicating potential reversal points.
- Overbought Conditions: When the MACD is significantly above zero, suggesting that the asset may be overextended to the upside.
- Oversold Conditions: When the MACD is well below zero, indicating that the asset may be oversold and due for a bounce. As a result, it’s possible to trade extreme highs/lows of the MACD as a sign that the market is overbought/oversold. As the indicator has no upper or lower limits, you should judge extremes by the visual comparison of the MACD levels. Notice that this kind of signal requires confirmation from price action or other technical indicators.

Traders often combine MACD analysis with other indicators like the Relative Strength Index (RSI) to enhance their understanding of overbought and oversold conditions.
5. Adaptable to Different Market Conditions: One of the strengths of MACD is its adaptability. Whether the market is trending strongly or moving sideways, the MACD can provide valuable insights. Traders can adjust the indicator’s settings to suit different timeframes and market dynamics.
Challenges and Considerations
Despite its popularity, MACD is not without its limitations and challenges. Traders should be aware of the following considerations:
- Whipsaws: In choppy or sideways markets, MACD crossovers can result in false signals, known as whipsaws. Traders need to exercise caution and use additional confirmatory tools to filter out such signals.
- Lagging Nature: Like many trend-following indicators, MACD is inherently lagging. Traders may miss the initial phase of a trend, and relying solely on MACD signals could lead to delayed entries or exits.
- Overbought and Oversold Conditions: MACD does not provide explicit overbought or oversold readings. Traders often use other indicators, such as the Relative Strength Index (RSI), in conjunction with MACD to identify extreme market conditions.
How to spot this divergence?
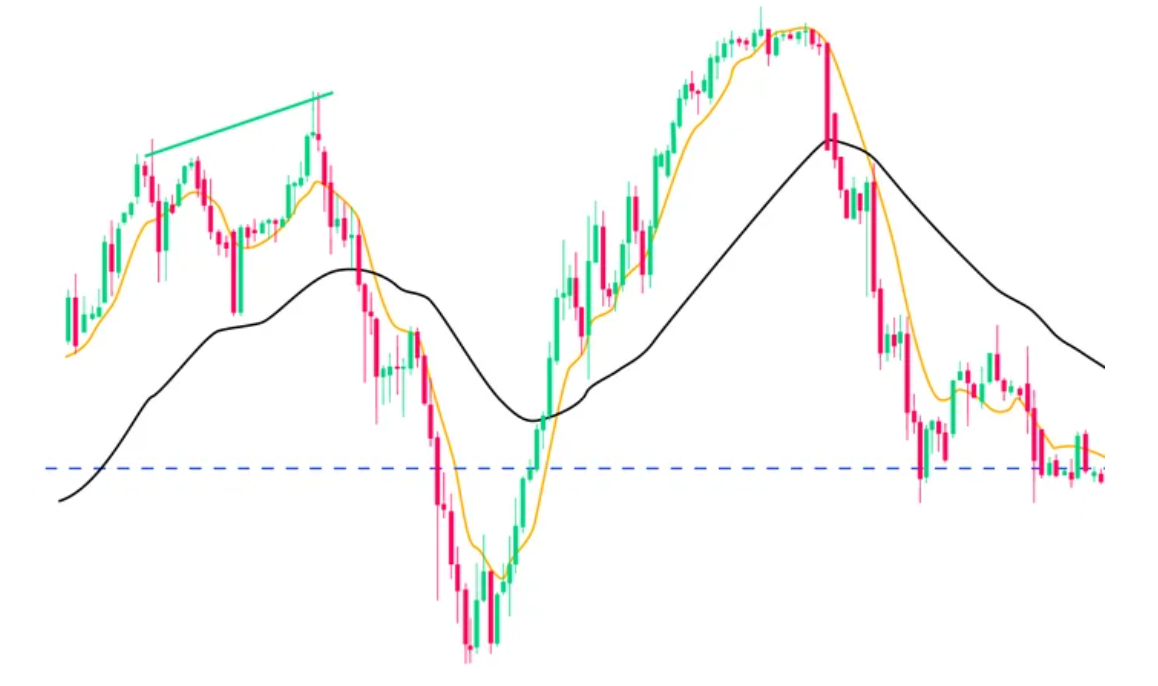
Consider the following example. The pound sterling is on an uptrend versus the Japanese yen, as seen in the chart below. A double top is building to the left of the chart, with the second top being higher than the first. However, if you check right below the MACD, you’ll notice that momentum is fading. Even if the price is rising, the gap between price and momentum indicates that a move to the negative is possible. Shortly after the bears retake control, the red line crosses the blue line and falls below the horizontal line; the price smashes through the 50-period EMA (Exponential Moving Average) and retraces heavily.
As we can see when momentum ceases, uncertainty sets in, sometimes quickly, and the shift in emotion causes a reversal. In general, the longer the timeline, the greater the magnitude of the reversal.

Three things to remember while utilizing the MACD
Here are some cautions to take if you use the MACD to guide your trading decisions:
Different timeframes and fake signals: You’ll notice that the MACD may occasionally produce a trade signal on a 15-minute chart that appears doubtful at best on a 4-hour chart. You can determine if a signal is trustworthy or not by recognizing regions of resistance and support before following it. You might also add moving averages into your plan to increase confluence.
MACD settings: Many skilled traders believe that the default settings (12, 26, and 9) are excessively sluggish, resulting in late entrance and withdrawal from a transaction. You may choose to customize/format the options and test them on a sample account.
Alternative options to test include:
8, 21, 5
3, 17, 5
3, 10, 16
What you’re looking for is how closely the crossing corresponds to the reversal on your chart. Experiment with Quotex’s demo account to determine which settings work best for the instruments you want to trade. Then, with increased confidence in your MACD technique, you can apply it to your actual account.
3. Double tops and double bottoms.
These candlestick patterns often appear at the end of a major market push-up or down. So, if the price has risen quickly with minimal resistance, but then encounters resistance and begins to fall, the price may drop just to retest the region of resistance because the move was done with high momentum. The bigger the momentum, whether positive or negative, the less trustworthy the indication.
KEY TAKEAWAYS
- Moving average convergence divergence is a trend-following momentum indicator that shows the relationship between two moving averages of a security’s price.
- Traders use the MACD to identify when bullish or bearish momentum is high to identify entry and exit points for trades.
- MACD is used by technical traders in stocks, bonds, commodities, and FX markets.
- There are several MACD strategies that traders can use, including the histogram, the crossover, the zero-cross, the money flow index, and the relative vigor index.
- One of the biggest risks of using a MACD is that a reversal signal can be a false indicator.
Conclusion:
The MACD’s effectiveness lies in its versatility, providing traders with a comprehensive set of tools to analyze trends, reversals, and momentum shifts. While it is a powerful standalone indicator, combining it with other technical analysis tools can enhance its predictive capabilities and contribute to more informed trading decisions in the ever-evolving financial markets.


